
The Orlando Market Pulse was just released a few hours ago with a few significant housing trends that stoodout. Let’s start at the overall picture of the local real estate market.
Take a look at the new listing graph below and the three sections I marked through with a black line, 2012, 2013 and 2014, see the similarities. The past 3 years new listings have increased from February to April, slight movements May through August and drastic declines each year September through the end of the year, normal market trends I talked about back in 2011. The overall sections are almost identical in stature with each subsequent year higher than the previous.
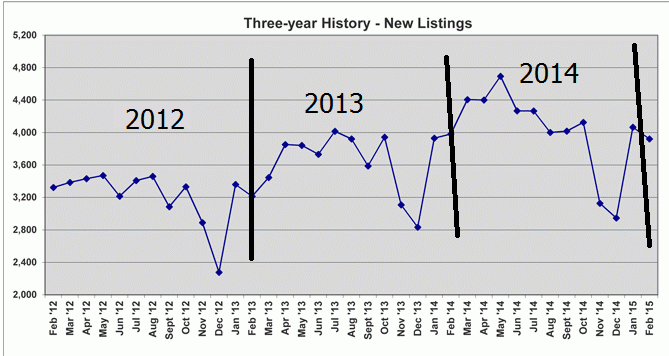
Expect new listings to again take another large jump in the coming months increasing the already high number of homes for sale.
Another number that has been increasing was “Days on Market” now at 88 days. This is the highest number we have had in the past few years. Real Estate is still about supply and demand and the supply is out there from your regular homes owners to new construction. Now more than ever knowing your home’s value from the start will help you make good decisions going forward.